
I Tried to Make Geography Class Fun - and it Actually Worked
Turning climate diagrams from passive memorization into active discovery.
Type
Educational Web App
Origin
2023 Thesis Prototype
Audience
Geography / Geology Classes
The Story
Normally, climate diagrams are taught the traditional way. Teacher stands at the board. “Precipitation this... equator that... subtropical high pressure zone...” Students copy it into their notebooks.
It works - but let's be honest: it's boring. So I tried a different idea. Instead of explaining climate zones, I wanted students to discover them themselves.
The goal was not to teach coding directly, but to train structured problem solving through interaction.
What Students Actually Do
Instead of reading definitions, they explore real meteorological data and test their own rules.
🔎Filter real weather stations
🗺️See matches directly on a world map
📈Open climate diagrams and compare results
🧪Refine thresholds until regions match the target climate
🎯Work through 16 progressively harder challenges


Tech Stack & Architecture
The technical backbone behind the classroom experience.
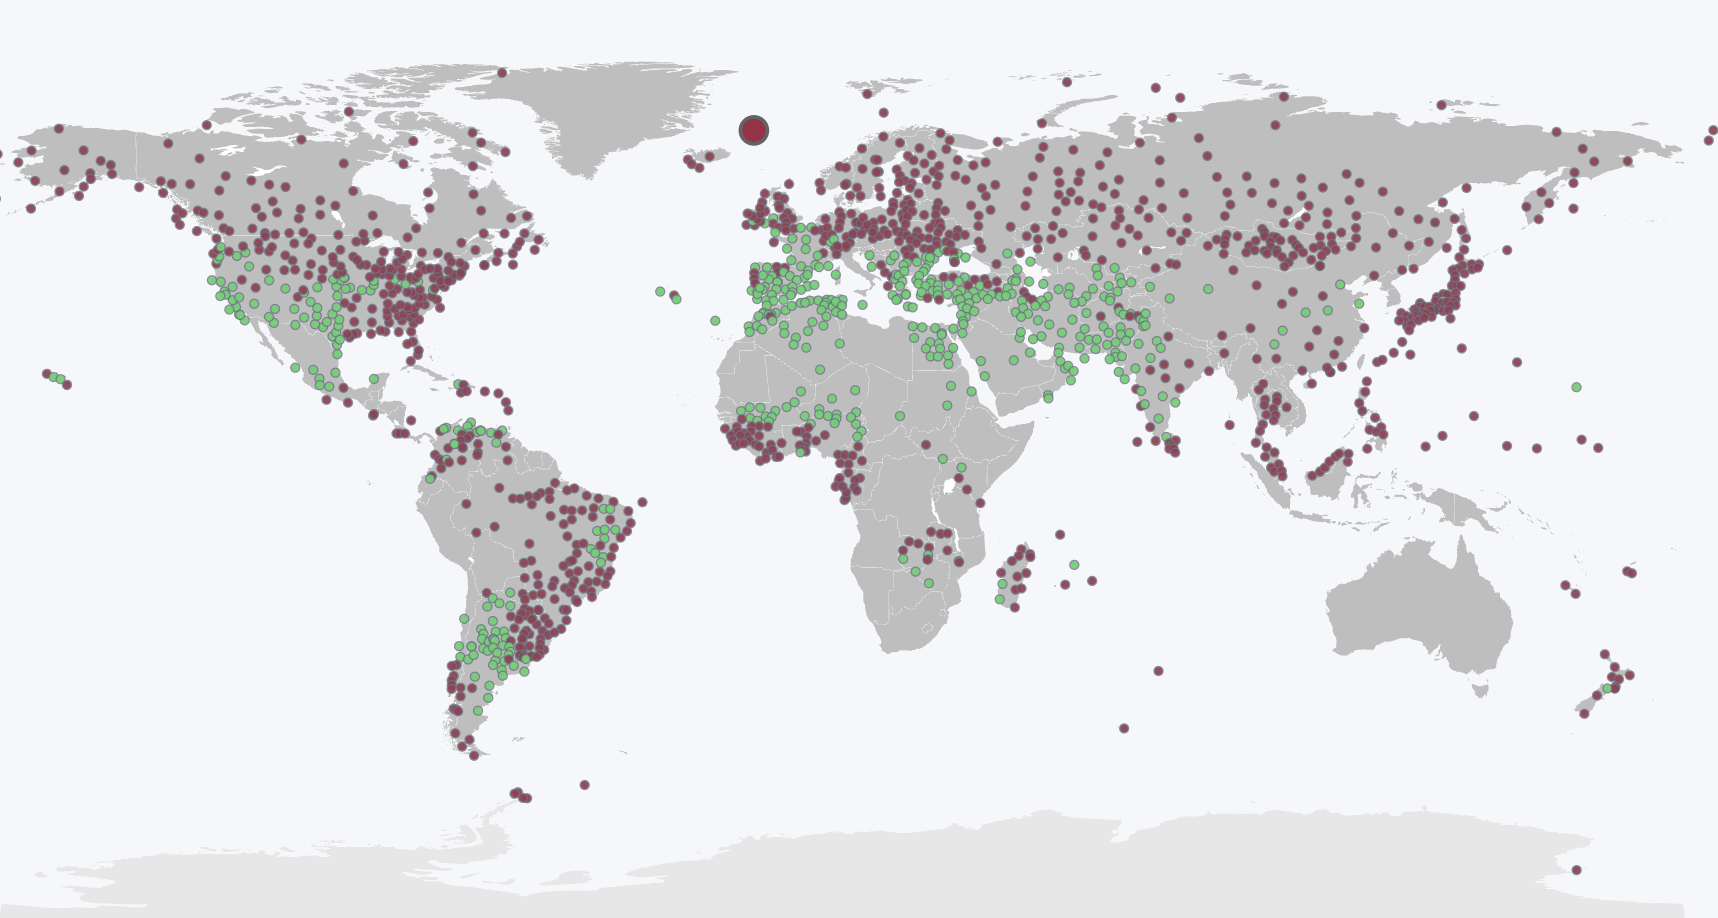
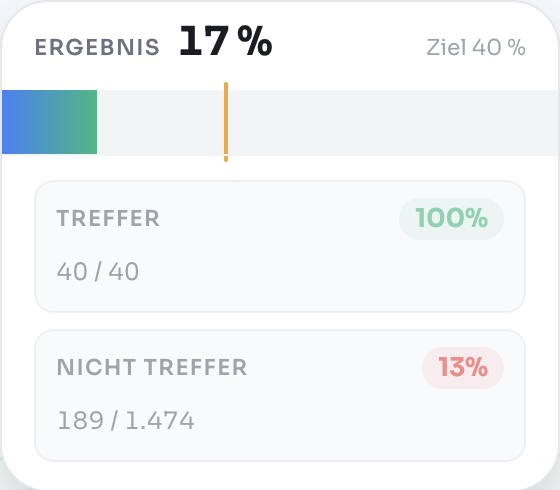
Reliable task filtering
Input Rules with Regex
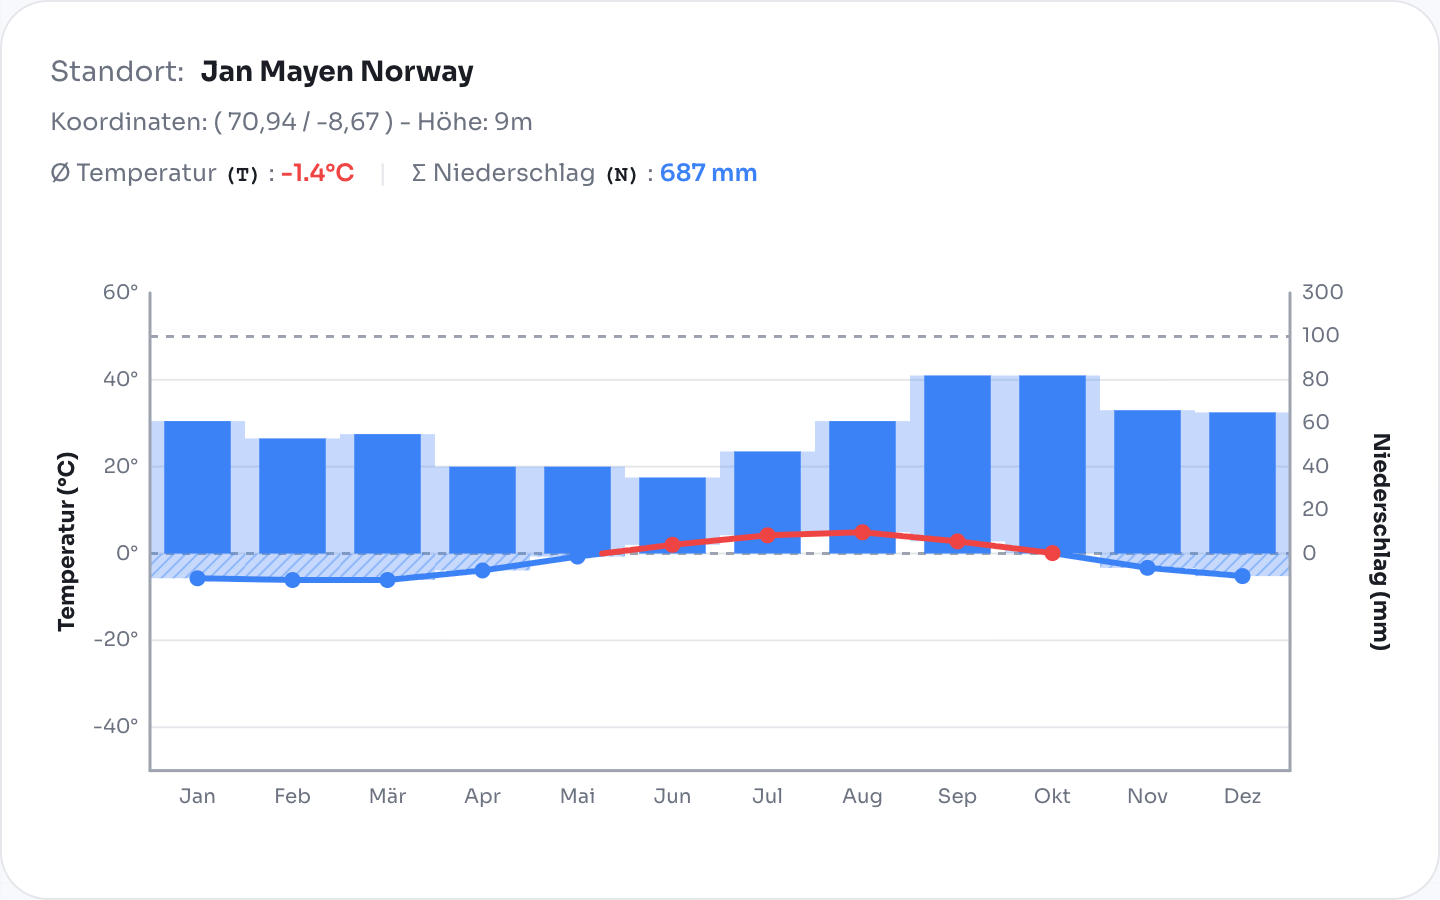
To keep student inputs valid, I added regex-based guards for numeric thresholds and ranges before any filtering logic runs.
This was very hard to test, since pupils should be able to type in very complex mathematical constructs.
Chart + map evolution
AMCharts First, Custom Rewrite Later
AMCharts helped me ship the early version quickly, but I later rebuilt both the climate chart and world map interactions for better performance and functionality.
The rewrite reduced rendering overhead, made interactions feel snappier, and improved clarity when students iterate through many rule changes.
Learning by discovery
Task-Driven UX
The flow is built around challenge prompts, immediate visual feedback, and rapid iteration, so students learn by testing hypotheses.
Every interaction is optimized to support experimentation rather than passive reading.
What Happened in the Classroom
It worked. Students started experimenting: “Wait - if the temperature is more equal across the year... only stations across the equator match.”
They debugged their own thinking, argued about results, and iterated. Climate diagrams were understood and not only learned.
Teacher feedback was positive, and students improved not only in geography but also in structured problem-solving.
From Research Prototype to Real Product
The first classroom tests ran on my 2023 thesis prototype, which was functional but rough. After graduating, I redesigned the UI, simplified the workflow, added clearer feedback, and made it feel much more like a game than a worksheet.
Free
Browser-based
No installation
(Currently German only.)
If you know a geography / geology teacher: send them the link.